It’s often difficult to determine which factors require the most attention in business decisions which can lead to focusing on the wrong things while ignoring what’s most important. Tornado graphs are an effective way to determine which aspects have the most impact on a business decision, so you can focus on what matters rather than negligible factors. Palisade’s @RISK, which has been used for years by many companies who utilize tornado graphs for sensitivity analyses, was just given multiple improvements to its tornado graph functions that offer new analytical features and simpler use to increase the ease of understanding and communicating your results.
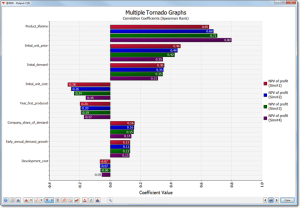
One of the new features of @RISK 7.5 is the ability to overlay multiple tornado graphs into one visual. Creating a separate chart for each simulation and then comparing the results can be both difficult to compare and time-consuming. With @RISK 7.5 you can simply overlay all of the simulations making comparison easier to see and communicate to others. Rather than focusing on communicating the comparison, you can jump right to making more informed decisions!
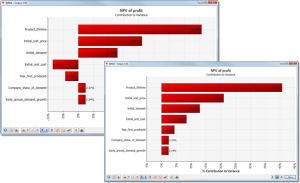
Another new exciting feature in @RISK 7.5 is the Contribution to Variance tornado graph function. This feature determines the amount of output variance is attributed to each factor so you can see which inputs are creating the most impact on the output. You can choose whether you want to see the magnitude and direction of the variance or just the magnitude to more easily compare the contribution variance.
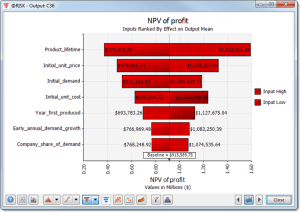
Finally, we have added a shading option to the Change in Output Mean tornado graphs to quickly see whether the input associated with each bar is high or low when the output statistic increases or decreases. In the example below you can see that when inputs such as Product Lifetime and Initial Unit Price are high, there is a positive impact on the net present value (NPV) of the project; when an input such as Initial Cost is high it will have a negative impact on the NPV.