
Background
A decade ago, relatively little was known about the impact of containership transit time on door-to-door logistics costs. Dr. John Tyworth, professor of supply chain management at Pennsylvania State University, and colleagues had discovered that different carrier companies serving the same port-to-port lanes had significant differences in actual carrier transit time and transit-time reliability.
“Buyers apparently do not perceive significant service differences between carriers,” says Tyworth. “This apparent gap between buyers' perceptions and reality may simply indicate that other reasons for supply chain variation dilute the benefits of superior ocean service enough to buttress buyers' beliefs that all ocean service is essentially comparable.”
If this “dilution” hypothesis is false, Tyworth and his colleagues posited that shippers would have important opportunities to reduce their logistics costs by making transit time and transit-time reliability a priority when selecting and managing their ocean transportation.
Tyworth and his business research colleagues at Pennsylvania State University as well as the project leader, John Saldahna, from Ohio State University set out to investigate the relationship between carrier ships’ transit time to door-to-door transit time, and to assess how ship speed and variability affects international supply chain costs.
"@RISK enabled us to clarify the value of standard and premium ocean services—and their respective speed and reliability—to determine the prices buyers might pay for such services."
Dr. John Tyworth
Professor at Pennsylvania State University
Project:
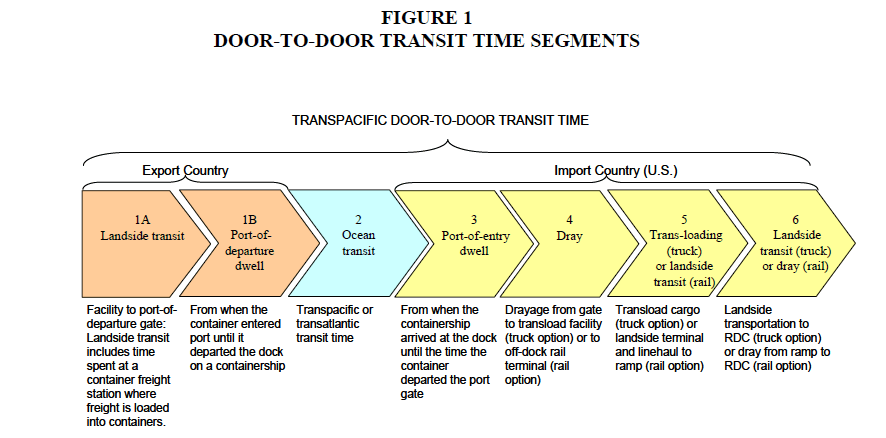
The researchers focused on the door-to-door shipment of marine containers, which move from a supplier’s hinterland location in Asia or Europe, to a port-of departure for ocean carriage, to a U.S. port-of-entry, and finally to an importer’s landside destination. They partitioned the total transit time for such shipments into the six segments shown in Figure 1 †.
If independent random variables characterize each segment’s transit time, the door-to-door transit time may be calculated as the sum of random draws from each variable’s statistical distribution. Thus, a door-to-door shipment time for a particular trade lane, ocean carrier, and landside mode of transportation represents the unit of analysis for testing the null hypothesis that differences in transit-time and transit-time reliability among ocean carriers have inconsequential effects on logistic costs.
The metric for testing that effect is the maximum spread in long-run logistics costs per twenty-foot equivalent (TEU) container for the same door-to-door itinerary.
After establishing the segment transit times, the team next determined distributions for each segment using either actual transit-time data or via gleaning realistic transit-time benchmarks from industry sources or studies.
The team used Monte Carlo simulations through Palisade’s @RISK software, which generated door-to-door transit time distributions by first taking a random draw from the transit-time probability density functions applicable to each segment and then summing the results to construct a sample observation of total transit time.
@RISK was run for 5,000 iterations. This approach creates common conditions across non-ocean segments to help isolate the effects of ocean carrier transit-time performance on door-to-door transit time.
@RISK also provided sensitivity analyses to indicate the magnitude of each time segment’s variance contribution to the total variance in door-to-door transit time for carrier.
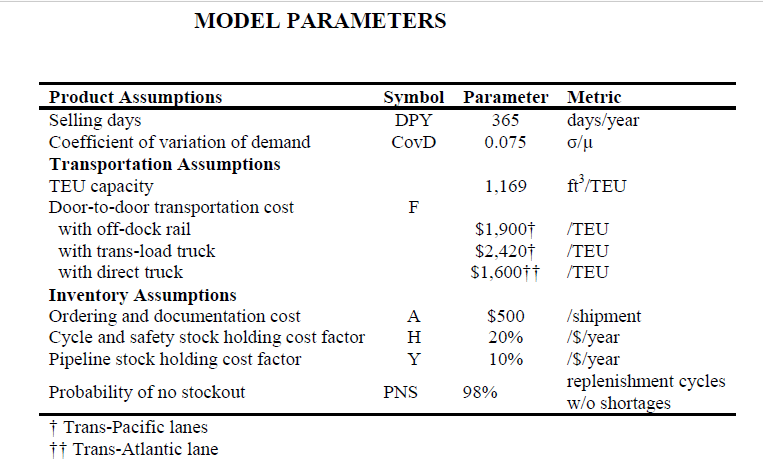
Model parameters are listed in the table below†:
For the last step, the researchers assessed the effects of ocean transit time and transit-time reliability on total logistics cost. They did this by first calculating the shipper’s total logistics cost for each ocean carrier serving a trade lane and then determining the range, or maximum difference, in the results.
Conclusion
After running these simulations, Tyworth and the rest of the research team found that the dilution hypothesis was in fact correct. “Delays and variation in non-ocean segments of the shipping chain in fact dilute the influence of superior ocean transit-time performance on total transit time,” says Tyworth. The key issue, therefore, is the economic value of superior ocean transit-time service to the shipper.
“Transit-time differences among ocean carriers are often secondary considerations in carrier selection,” says Tyworth. “However, we found that shippers can pay substantial premiums for superior ocean transit-time service and cut logistics costs even when substantial variability occurs in landside segments of supply chains.”
Through the simulations conducted through @RISK, the authors of the study were able to evaluate key inventory and transportation cost trade-offs under realistic operating conditions. “@RISK enabled us to clarify the value of standard and premium ocean services—and their respective speed and reliability—to determine the prices buyers might pay for such services,” says Tyworth.
† Saldahna, J. P., Tyworth, J. E., Swan, P. F., Russell, D. M. 2009. Cutting logistics costs with ocean carrier selection. Journal of business logistics 30 (2), 175-195. https://doi.org/10.1002/j.2158-1592.2009.tb00118.x