
Background
The Team: Mark Abramovich, MBA Principal of Interdisciplinary Solutions, LLC, formed a work group with the Johns Hopkins Center for Health Security (JHSPH) represented by Dr. Eric Toner, MD and Dr. Amesh Adalja, MD to tackle this issue. Dr. Pritish Tosh, MD, a Mayo Clinic Infectious Disease Specialist, and Byron Callies, MSHS, Mayo Clinic’s Director for Clinical & Business Continuity Management, represented the workgroup for Mayo Clinic, which funded the work. John C. Hershey, PhD of the University of Pennsylvania's Wharton School supervised the operations component.
The Challenge: Hospital pandemic preparedness has been hampered by a lack of sufficiently specific planning guidance. In large part, this is because differences among hospitals and between various pandemic scenarios make it difficult to provide useful guidance that is broadly applicable to all hospitals. The elements for consideration in hospital pandemic planning and health care surge capacity have been well described, but the complex and dynamic interrelationships between these elements must be taken into consideration. Several computer-based decision-making tools have been developed to deal with this problem, but, these tools were limited--particularly with respect to dealing with the many uncertainties inherent in hospital pandemic planning and the operational interdependencies of response activities. For example, changing bed or ventilator capacity affects staffing, supply, and pharmaceutical needs and vice versa. Previous models also did not adequately account for operational chokepoints and bottlenecks, such as emergency department throughput and dynamic staffing patterns.
Gathering Pandemic Data
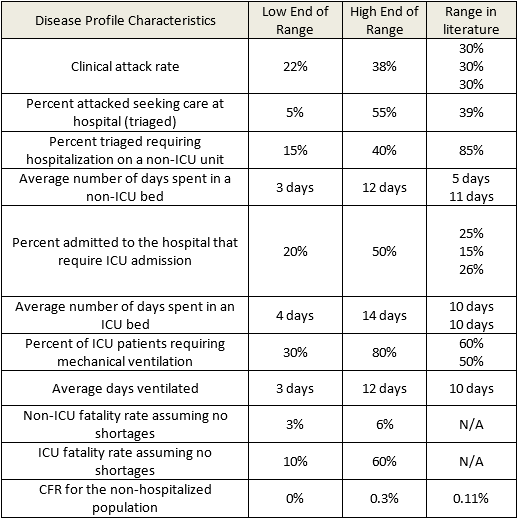
To address the issue, Abramovich decided to apply Monte Carlo simulation via @RISK. First, along with Drs. Toner and Adalja, he gathered ranges of epidemiologic variables (e.g., clinical attack rate, hospitalization rate, hospital length of stay by unit type, percent requiring mechanical ventilation, and case fatality rate) for a portion of a local, severe influenza pandemic in the U.S. This data was determined by review of the literature and/or expert consensus of the project team (Table 1).
Mark Abramovich
Next, in modeling the data, Abramovich used the shape of the epidemiologic curve from the second wave of the 1918 influenza pandemic in London, England. “It was selected because it is the most relevant historical example we could find and it is consistent with epidemiologic curves used in other influenza pandemic modeling efforts,” he says.
Mayo Clinic provided catchment population data as coordinated by Byron Callies. “We assumed Mayo Clinic would provide care for its entire geographic catchment population,” Abramovich explains. “Age distribution was determined through U.S. census data.”
Abramovich used case fatality rate (CFR) as a proxy of severity, using three different CFRs to explore the effect of various shortages:
- The CFR of patients who died outside the hospital,
- The CFR in a non-intensive care unit (ICU) bed, and
- The CFR for ICU patients and for patients on a ventilator
These CFR values were determined by Drs. Toner and Adalja and were then normalized to collectively equal the expected population-based CFR of 0.93% ± 0.23%. “To determine this value, we estimated that if an influenza pandemic of the same severity as occurred in 1918 occurred today the CFR would be reduced from the historic 2.5% to 0.93% due to advances in medical technology,” Dr. Toner stated.
Additionally, the team surveyed Mayo Clinic to determine the number of free beds, ventilators, and anesthesia machines likely to be available during an influenza pandemic. Drs. Toner, Adlaja, and Tosh then determined the key pharmaceuticals and supplies that would be necessary during a pandemic.
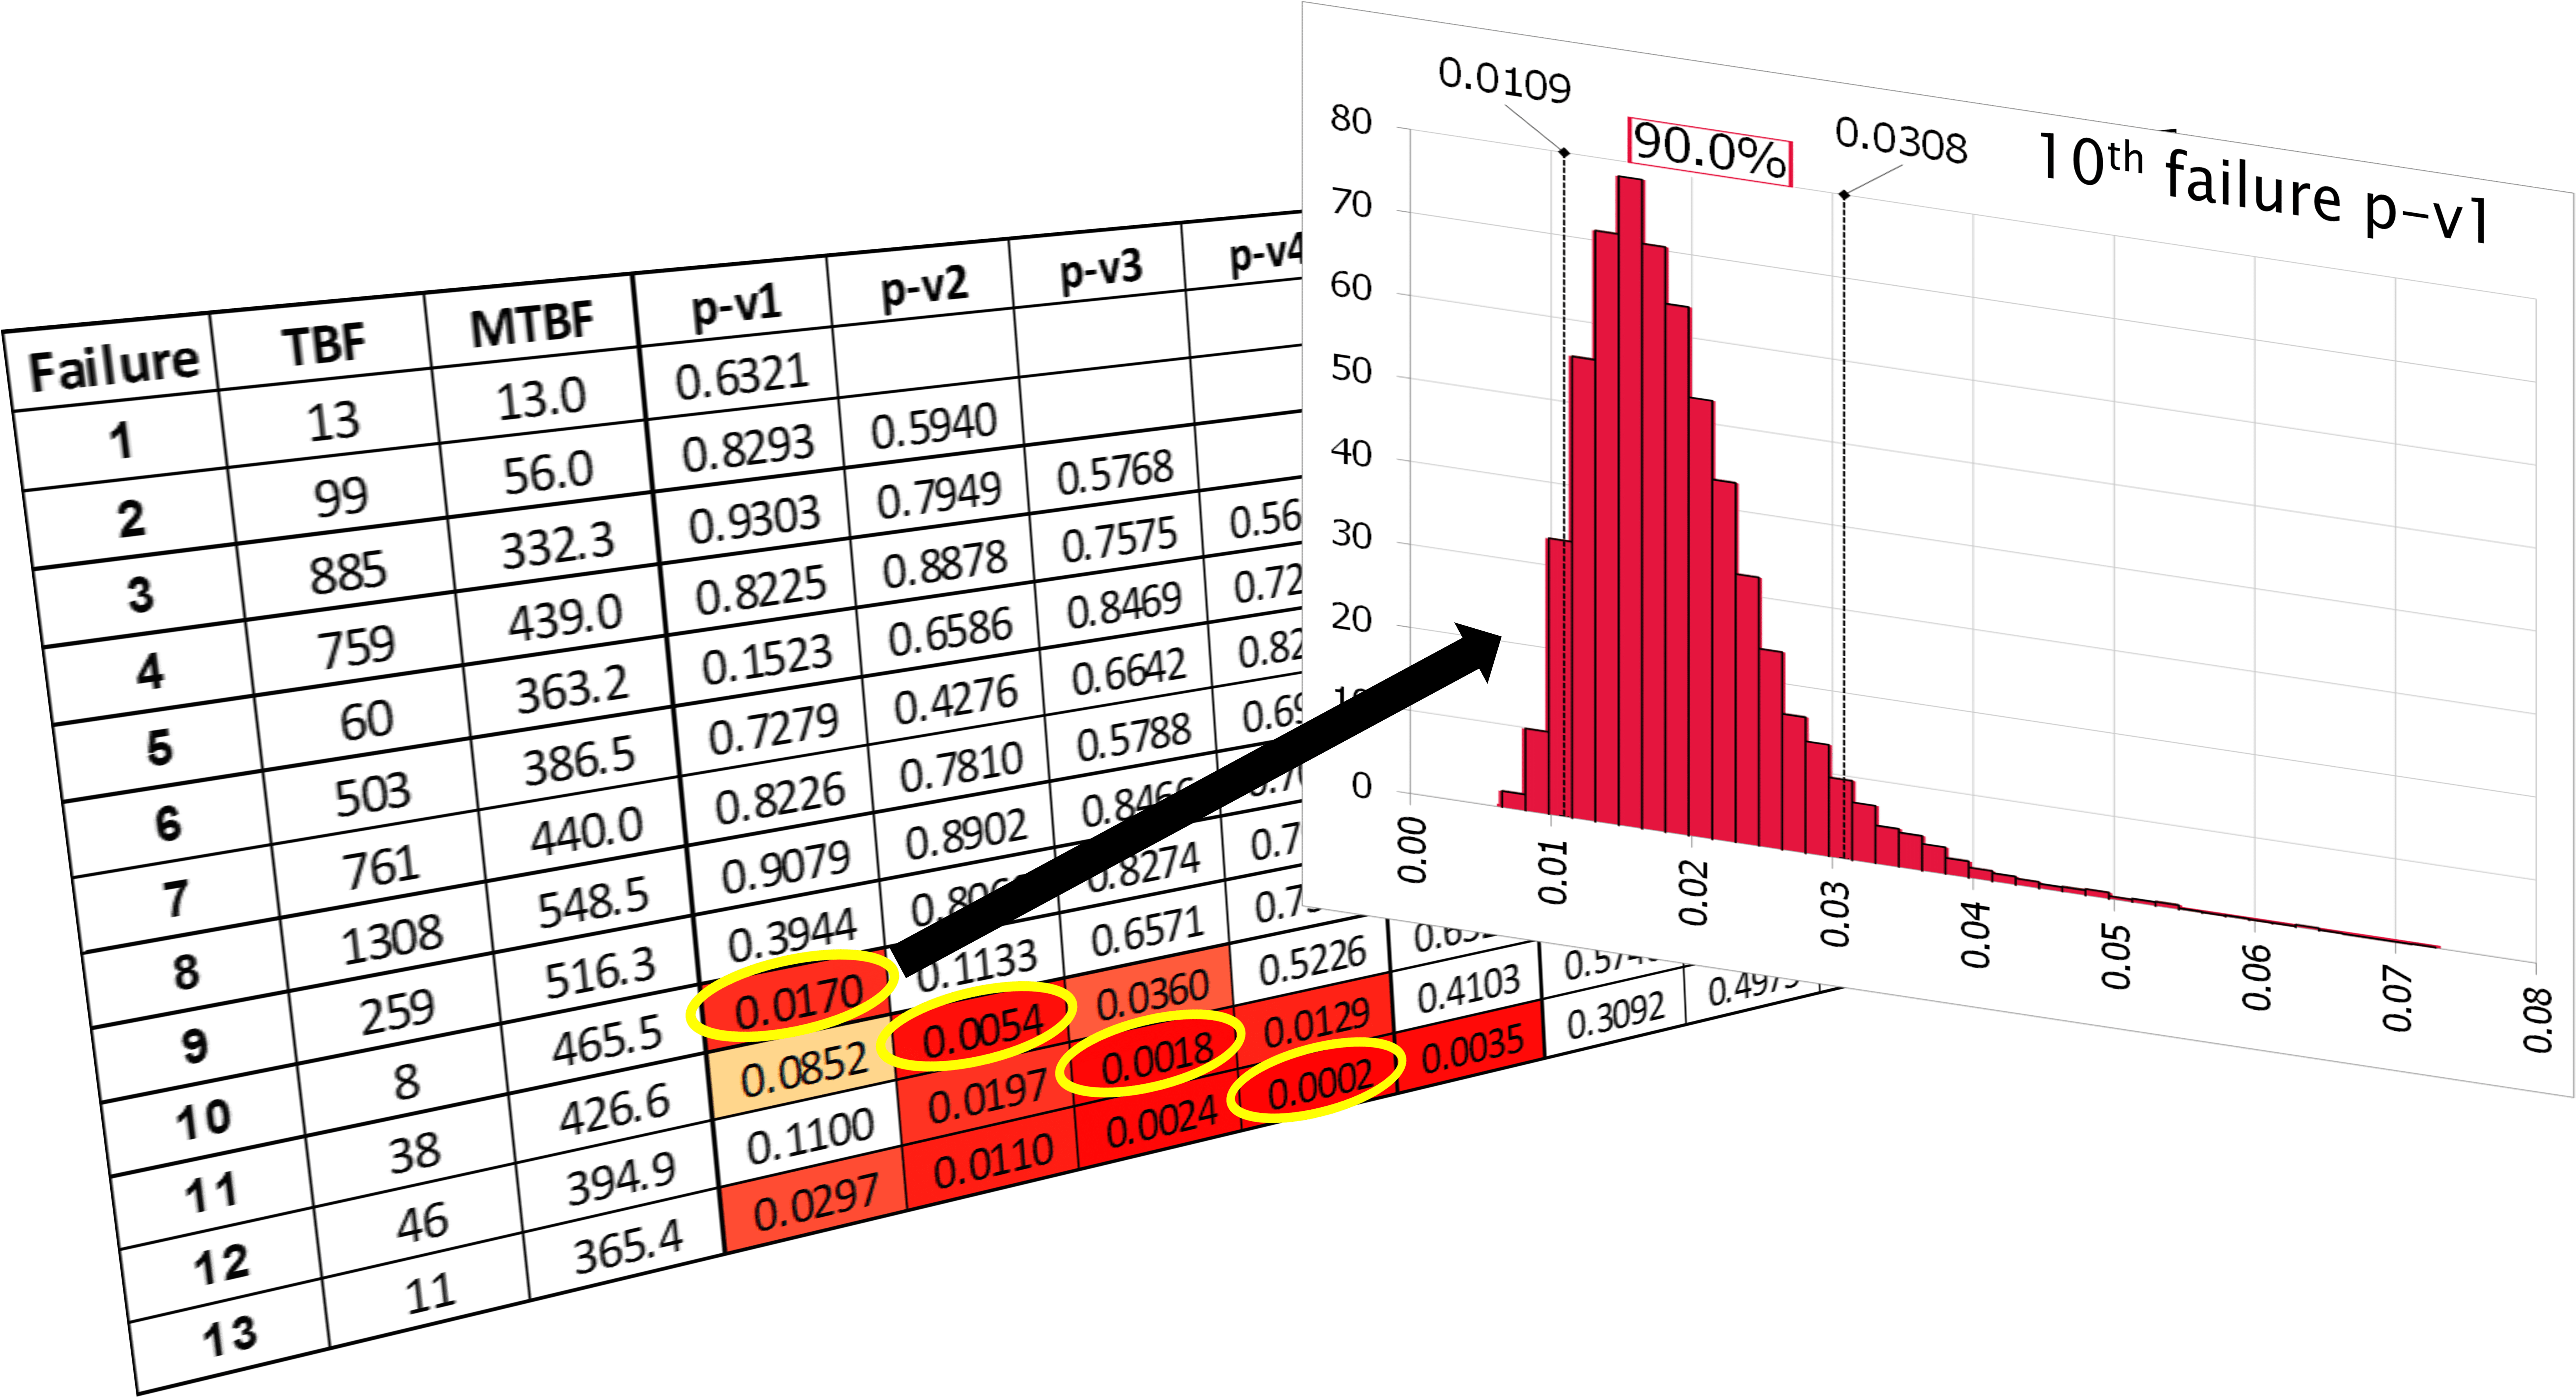
All this vital data was used to run 10,000 Monte Carlo simulations on @RISK, using various combinations of variables to determine resource needs across a spectrum of scenarios.
To test Mayo Clinic’s bed and ventilator capacity during an influenza pandemic, the investigators also ran scenarios in which beds were constrained but not ventilators, and vice versa. “Based on these results, we determined the percent of scenarios in which Mayo Clinic would have sufficient beds but not ventilators, ventilators but not beds, and a sufficient number of both,” says Abramovich.Next, in modeling the data, Abramovich used the shape of the epidemiologic curve from the second wave of the 1918 influenza pandemic in London, England. “It was selected because it is the most relevant historical example we could find and it is consistent with epidemiologic curves used in other influenza pandemic modeling efforts,” he says.
Mayo Clinic provided catchment population data as coordinated by Byron Callies. “We assumed Mayo Clinic would provide care for its entire geographic catchment population,” Abramovich explains. “Age distribution was determined through U.S. census data.”
Abramovich used case fatality rate (CFR) as a proxy of severity, using three different CFRs to explore the effect of various shortages:
- The CFR of patients who died outside the hospital,
- The CFR in a non-intensive care unit (ICU) bed, and
- The CFR for ICU patients and for patients on a ventilator
These CFR values were determined by Drs. Toner and Adalja and were then normalized to collectively equal the expected population-based CFR of 0.93% ± 0.23%. “To determine this value, we estimated that if an influenza pandemic of the same severity as occurred in 1918 occurred today the CFR would be reduced from the historic 2.5% to 0.93% due to advances in medical technology,” Dr. Toner stated.
Additionally, the team surveyed Mayo Clinic to determine the number of free beds, ventilators, and anesthesia machines likely to be available during an influenza pandemic. Drs. Toner, Adlaja, and Tosh then determined the key pharmaceuticals and supplies that would be necessary during a pandemic.
All this vital data was used to run 10,000 Monte Carlo simulations on @RISK, using various combinations of variables to determine resource needs across a spectrum of scenarios.
To test Mayo Clinic’s bed and ventilator capacity during an influenza pandemic, the investigators also ran scenarios in which beds were constrained but not ventilators, and vice versa. “Based on these results, we determined the percent of scenarios in which Mayo Clinic would have sufficient beds but not ventilators, ventilators but not beds, and a sufficient number of both,” says Abramovich.
Stockpiling: Moderation is Key
Of the 10,000 iterations done by @RISK, 1,315 fell within the parameters defined by Abramovich’s simulation design and logical constraints. From these valid iterations, he projected supply requirements by percentile for key supplies, pharmaceuticals, and personal protective equipment needed in a severe pandemic.
As an example, Figure 1 displays the model output for four key resources: oseltamivir, ventilator circuits, N95 respirators (following state use guidelines), and gloves. These cumulative probability graphs show the number of units of each resource (for oseltamivir it shows the number of treatment courses) that are needed across the distribution of included scenario iterations.
“From our results, it is clear that the biggest return on investment for all resources is having some stockpile, even if it is relatively modest,” says Dr. Toner. For example, the graph shows that 4,998 courses of oseltamivir would be sufficient for 95% of scenarios and approximately 4,000 courses would be sufficient for 88% of scenarios. “One can see that relatively little incremental benefit is gained by the additional 1,000 courses,” says Dr. Toner. “On the other hand, only 2,200 courses are needed for half the scenarios.”
Monte Carlo Simulation with @RISK Helps Improve Hospital Preparedness
“Although Monte Carlo simulation cannot identify the single best strategy, it allows the decision maker to understand the range of potential outcomes and how they change based on differing assumptions, and allows for decision making with respect to uncertainty and the user’s risk tolerance” says Abramovich. Through this approach, he and his team projected supplies needs for a range of scenarios that use up to 100% of Mayo Clinic Hospital – Rochester’s surge capacity of beds and ventilators. The results indicate that there are diminishing patient care benefits for stockpiling on the high side of the range, but that having some stockpile of critical resources, even if it is relatively modest, is most important.
Abramovich presented the spectrum of model outputs to Mayo Clinic administrators for their consideration of the hospital’s stockpiling needs. “The Panálysis model in conjunction with @RISK allows users to see how the stockpile’s need of one resource relates to another, to easily recalculate needs based on changing assumptions or evidence, and to identify operational bottlenecks and to test different response tactics.” Abramovich says. “We were able to display the probabilities of needing various supply levels across a spectrum of scenarios—this is a tool that could be used to model many other hospital preparedness issues.” Callies of Mayo Clinic said, “This modeling approach provided a rational basis for informed decision making for our disaster stockpile needs. As a result, by establishing a common level of preparedness based on the modeling outcomes and the organization’s risk tolerance, we were able to align and improve preparedness efforts across multiple functional groups while at the same time being good stewards of the organization’s resources.”