fbpx

Mitigate Risks

Statistical Analysis and Forecasting

Improve your forecasting and decision-making by applying powerful statistical analysis to your data, directly in your Excel spreadsheet. With predictive modeling and forecasting techniques, you can gain the insight needed to make critical decisions with confidence for cases such as demand forecasting, pricing, portfolio allocation, load planning, sales forecasting, strategic planning, profit projections, and more.

Make Better Decisions with Quantitative Insights

When your organization has access to useful and potentially critical data, easy and effective analysis is a must. Competitive advantage can be gained with better knowledge of the potential future outcomes, group comparisons and by measuring dependency. A deep and accurate statistical and visual understanding of key variables is invaluable.

Statistical analysis and forecasting provide this with quantitative and graphical results to display to your key stakeholders.

What is Statistical Analysis and Forecasting?

The Monte Carlo method is a computerized mathematical technique that allows people to quantitatively account for risk in forecasting and decision-making. At its core, the Monte Carlo method is a way to use random samples of parameters to explore the behavior of a complex system. A Monte Carlo simulation is used to handle an extensive range of problems in a variety of different fields to understand the impact of risk and uncertainty.

Range of Techniques Across Many Industries

Statistical analysis and forecasting represent a broad range of techniques. It is used in all sectors such as manufacturing & consumer goods, healthcare & pharmaceuticals, finance & banking, insurance & reinsurance, pharmaceuticals, aerospace & defense, energy & utilities, and others. 

Predict the Future from the Past

Historically observed data can be described in terms of useful summary statistics for each variable, as well as the dependency across variables. Predictive modeling and forecasting techniques are applied to the data set, generating a reliable picture of the future to assist your decision making. Methods of statistical inference, hypothesis tests and quality control fulfill more specialized needs.

Visual Communication

Graphs and charts help to visualize variables and results from statistical methods and are an invaluable resource for effectively communicating outcomes.
Common use cases include:
Demand forecasting
Load planning
Pricing
Sales forecasting
Portfolio allocation
Strategic planning
Six Sigma and quality control, and much more
Profit Projections

A Range of Outcomes (one col list)

Monte Carlo simulation furnishes the decision-maker with a range of possible outcomes and the probabilities they will occur for any choice of action. It shows:
the extreme possibilities
the outcomes of going for broke and for the most conservative decision
along with all possible consequences for middle-of-the-road decisions

History of Monte Carlo Simulation

The technique was first used by scientists working on the atom bomb; it was named for Monte Carlo, the Monaco resort town renowned for its casinos. Since its introduction in World War II, Monte Carlo simulation has been used to model a variety of physical and conceptual systems.

How Does Statistical Analysis and Forecasting Work?

Statistical analysis and forecasting start with a data set. From here you determine which analyses are most relevant to you. Any variable can be described with statistics calculated directly from the data, or shown in graphical summaries such as histograms and box plots. Time series can be forecasted any number of periods into the future using techniques that include trending and seasonality options. Forecasts can be represented graphically, greatly facilitating discussions and decision-making among all stakeholders. Quality control methods can also be applied to time series variables, creating Pareto and X/R charts (among others) to identify the most significant types of defect occurrences as well as the frequency of variation. These types of analyses are important in producing products or services of consistent high quality, such as in Six Sigma work.

When the data set contains related observations of dependent and independent variables, techniques such as regression and cluster analysis become appropriate. Statistical inference work such as ANOVA (analysis of variance) and nonparametric tests on the data form the basis of valid claims of significance. Correlations are calculated between variables to highlight dependencies your organization is exposed to.
An ANOVA statistical analysis comparing the means of different data sets.

100% Microsoft Excel Integration

With PrecisionTree, you never leave your spreadsheet, allowing you to work in a familiar environment, and get up to speed quickly.

Full Statistics Reports and Graphs

See results in risk profile graphs, 2-way sensitivity, tornado graphs, spider graphs, policy suggestion reports, and strategy-region graphs.

Advanced Features

Set up your decision tree in Microsoft Excel exactly as you need it with logic nodes, reference nodes, linked trees, custom utility functions, and influence diagrams.

Types of Statistical Analysis

There are different types of statistical analysis, employing different mathematical techniques to achieve different goals. Some of the more common types include:
Descriptive Statistics – These summarize a data set and visualize it with charts and graphs.
Statistical Inference – These analyses examine a sample of the entire data set to test a hypothesis and draw conclusions about the entire population.
Regression – These are techniques which model the relationship between a dependent variable and one or more independent variables in order to make predictions.
Forecasting – These are analyses applying statistics to historical data to project what could happen in the future.

FEATURES LIST (not always shown)

FeatureBenefitProfessional EditionIndustrial Edition
Optimization under uncertaintyCombines Monte Carlo simulation with sophisticated optimization techniques to find optimal solutions to uncertain problems. Used for budgeting, allocation, scheduling, and more.
Efficient Frontier AnalysisEspecially useful in financial analysis, Efficient Frontiers determine the optimal return that can be expected from a portfolio at a given level of risk
Ranges for adjustable cells and constraintsStreamlined model setup and editing
Genetic algorithmsFind the best global solution while avoiding getting caught in local, “hill-climbing” solutions
Six solving methods, including GAs and OptQuestAlways have the best method for different types of problems
RISKOptimizer Watcher and Convergence MonitoringMonitor progress toward best solutions in real time
Overlay of Optimized vs Original DistributionCompare original output to optimized result to visually see improvements
Original, Best, Last model updatingInstantly see the effects of three solutions on your entire model

Random Sampling Versus Best Guess

During a Monte Carlo simulation, values are sampled at random from the input probability distributions. Each set of samples is called an iteration, and the resulting outcome from that sample is recorded. Monte Carlo simulation does this hundreds or thousands of times, and the result is a probability distribution of possible outcomes. In this way, Monte Carlo simulation provides a much more comprehensive view of what may happen. It tells you not only what could happen, but how likely it is to happen.

Monte Carlo simulation provides a number of advantages over deterministic, or “single-point estimate” analysis:
Probabilistic Results. Results show not only what could happen, but how likely each outcome is.
Graphical Results. Because of the data a Monte Carlo simulation generates, it’s easy to create graphs of different outcomes and their chances of occurrence. This is important for communicating findings to other stakeholders.
Sensitivity Analysis. Deterministic analysis makes it difficult to see which variables impact the outcome the most. In Monte Carlo simulation, it’s easy to see which inputs had the biggest effect on bottom-line results. This allows you to identify and mitigate factors which cause the most risk.
Scenario Analysis: In deterministic models, it’s very difficult to model different combinations of values for different inputs to see the effects of truly different scenarios. Using Monte Carlo simulation, analysts can see exactly which inputs had which values together when certain outcomes occurred. This is invaluable for pursuing further analysis.
Correlation of Inputs. In Monte Carlo simulation, it’s possible to model interdependent relationships between input variables. It’s important for accuracy to represent how, in reality, when some factors go up or down, others go up or down accordingly.
An enhancement to Monte Carlo simulation is the use of Latin Hypercube sampling, which samples more accurately from the full range of values within distribution functions and produces results more quickly.

How PrecisionTree Is Used

PrecisionTree has a multitude of applications, including:
Oil, Gas, & Mineral Reserves: Map out sequential, probabilistic exploration plans of prospective sites containing oil, natural gas, or other minerals. Estimate uncertain reserves to make wise drilling decisions.
Litigation & Bidding Strategy: Plan step-by-step strategies in complex legal or business negotiations, or when bidding on contracts. Map what could happen at each stage and your response to, along with probabilistic chance events.
Real Options Valution: Quantify the value of real options, or the right to undertake an investment or not, in the face of uncertainty future outcomes.
Supply Chain Management: Develop multi-stage plans for complex supply chains, incorporating probabilities of failures and other chance events.
Medical Treatment Planning: Establish sequential, multi-stage treatment plans for complex medical conditions given uncertain outcomes at each stage.

Enterprise Licensing
Better Research, Insights, and Outcomes for All

Whether your organization’s focus is qualitative, quantitative, or mixed methods data analysis, we can help your whole team work better together — collaborating to aggregate, organize, analyze, and present your findings. Lumivero’s enterprise licensing options offer volume pricing for teams and organizations needing nine (9) or more licenses.

Enterprise licenses allow the flexibility to install Lumivero software and solutions on multiple computers (up to the maximum number of licenses that your site has purchased) with a centralized management solution.

Lumivero’s team-based solutions allow you to:

Stay up-to-date with free upgrades to the latest releases
Reduce IT costs with one platform deployed across your organization
Reassign licenses to different users as teams evolve
Centralize license and subscription management in one place
Streamline budget allocation, especially for smaller groups and consultancy firms
Enjoy a Dedicated Customer Success Manager and pro-rated rates for new users

Statistical Analysis and Forecasting Software from Lumivero

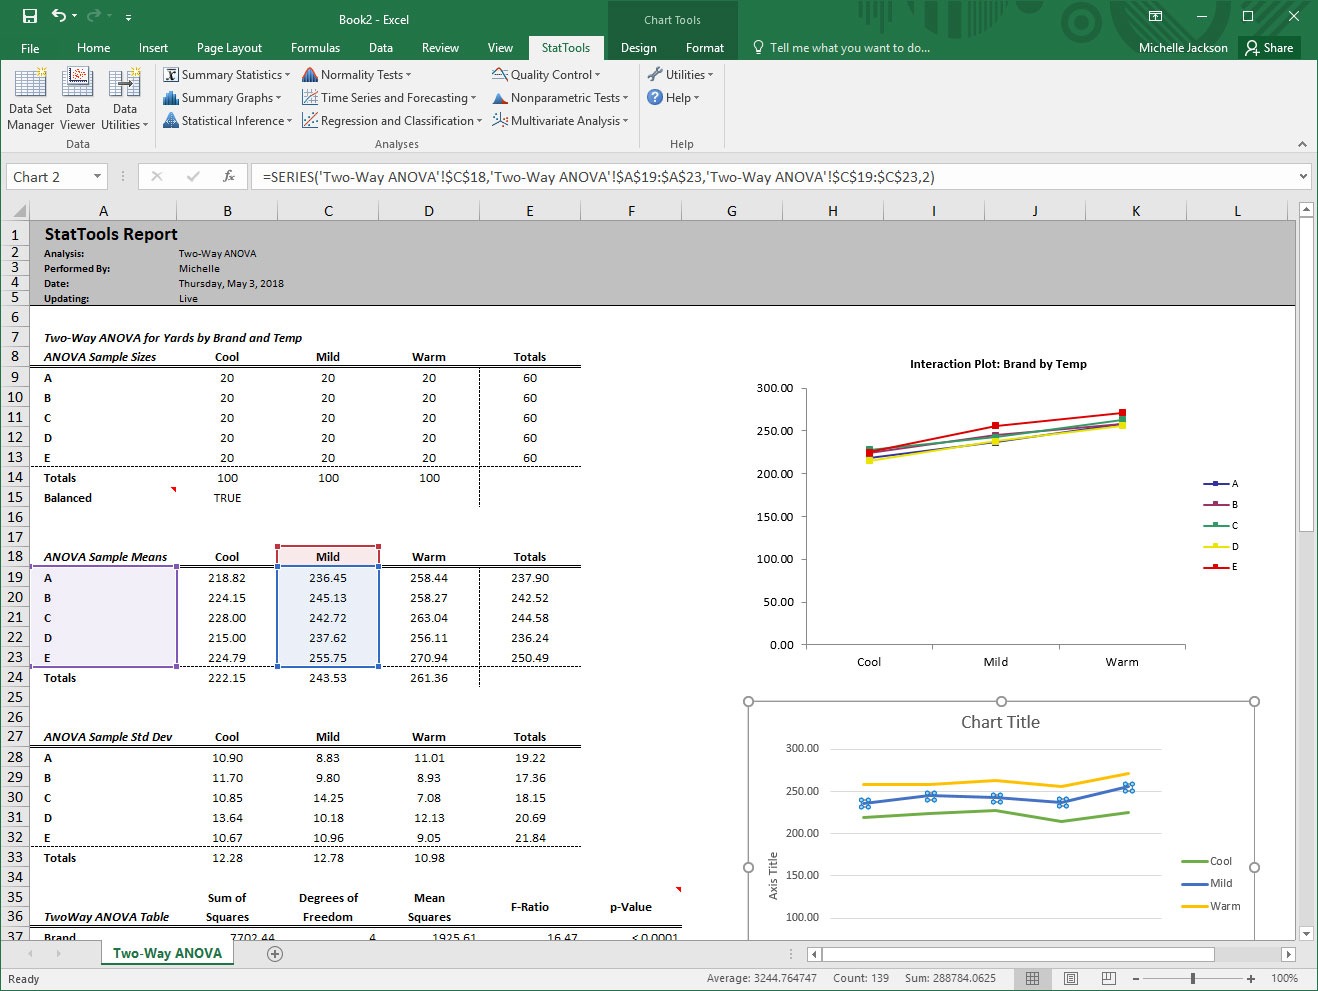
Lumivero’s StatTools software brings robust statistical analysis and forecasting power to Excel. With StatTools, any Excel user can apply any of over three dozen statistical and forecasting analyses to data directly in their spreadsheet. All StatTools functions behave exactly as native Excel functions do, so there is no learning curve. Furthermore, StatTools is designed to work closely with Lumivero’s NeuralTools product for neural networks prediction, making for a combined data analysis powerhouse unavailable anywhere else.

magnifierarrow-right
linkedin facebook pinterest youtube rss twitter instagram facebook-blank rss-blank linkedin-blank pinterest youtube twitter instagram