
A Purchasing Strategy Example Considering Suboptimal Decisions
Lumivero’s PrecisionTree software allows you to analyze the probabilities of different outcomes, and their impacts, in sequential, multi-stage decisions. The decision trees in PrecisionTree show the probabilities of these outcomes assuming that the optimal decisions are made at each of the decision nodes (points in the process where a decision needs to be made) in the tree. “Optimal” is defined by the software as the path ultimately leading to the greatest or least (as defined by the user) payoff of the entire process. But analyzing the suboptimal decisions with PrecisionTree can also lead to valuable insights.
Consider a situation that is directly relevant to the supply chain issues that continue to impede the global economy: a manufacturer weighing different purchasing strategies for a raw material commodity such as lumber, oil, or sugar. The manufacturer has three options:
- It can wait six months and purchase the commodity then at the going price.
- It can buy a futures contract now for the full amount needed of the material at a set price, which guarantees the delivery of the commodity in six months at a locked-in price equal to the current price.
- It can go halfway between options one and two, buying a futures contract now for half of the full amount needed at a set price equal to the current price, and waiting to purchase the other half at the going price in six months. There is considerable uncertainty about the price of the commodity in six months.
The decision tree mapping out this problem calculates the possible payoffs of each purchasing strategy, based on the uncertain movement of the commodity’s price in six months. Here is an example of what this decision looks like, considering the possibilities of the price going up a lot, going up a little, staying the same, going down a little, or going down a lot:
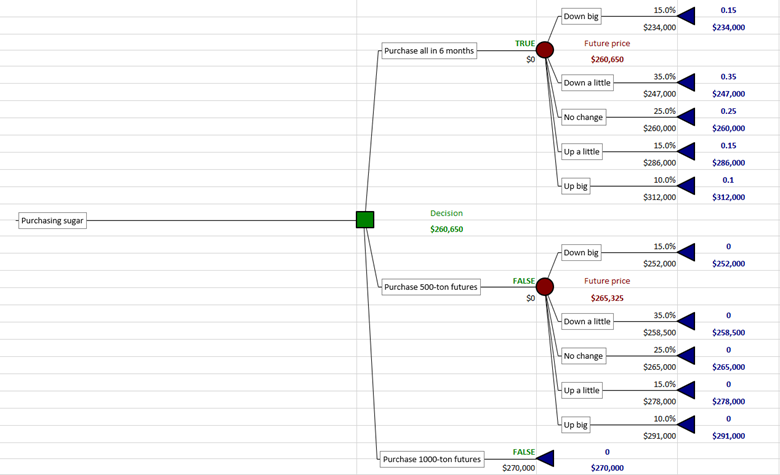
Purchasing strategy decision in PrecisionTree
You can run a decision analysis in PrecisionTree to obtain a risk profile chart that displays the payoffs of each possible decision outcome for each of the three purchasing strategy choices, and the probabilities each will occur:
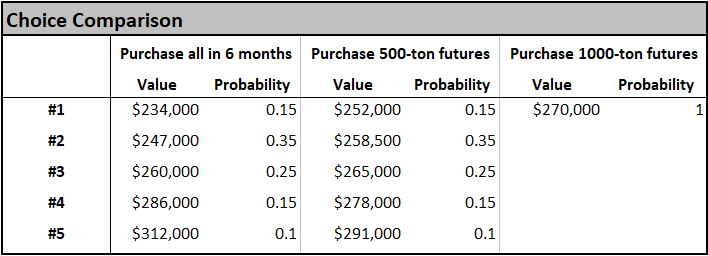
Risk profile data showing probabilities and payoffs of each decision outcome for each purchasing strategy choice.
We can multiply each “Value” and its “Probability” to get what you could call “Expected Value Components.” These are the probability-adjusted values of each decision outcome payoff. Adding the Expected Value Components in each column with get us the expected value of each given choice. Here is the same chart with these expected values calculated:
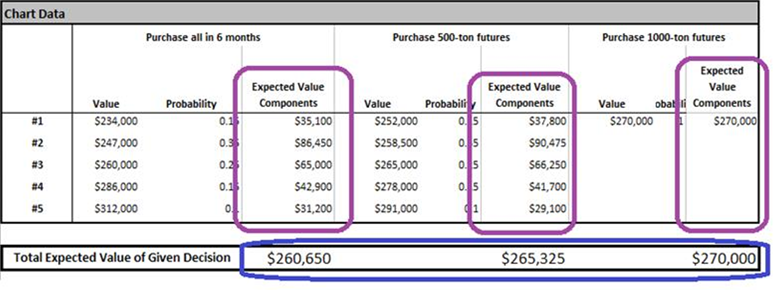
Risk profile data showing expected values of the payoffs of each decision outcome.
You can check the accuracy of this analysis by comparing the circled total expected values of each choice against the same values displayed in the original decision tree:
Expected values of the payoffs of each choice in the decision tree.
So we don’t need these manual steps to get the expected value for each choice; the numbers are there in the tree to begin with. But we needed to perform these steps to get the intermediate Expected Values Components of each possible decision outcome. (Code could be written to perform these manual steps automatically, using VBA and the Excel programming interface of PrecisionTree, called the PrecisionTree XDK.)
But why do this? Why does the probability-adjusted payoff value of each possible outcome from each strategy choice matter? As noted earlier, PrecisionTree interprets “optimal” as maximizing or minimizing expected value of the entire tree. But we don’t necessarily always want to do that. You may want to see the expected values of each individual outcome to make the best decision for you, based on your own preferences, even if it's considered a suboptimal decision. Consider a bet that pays $1 million + $1 ($1,000,001) if a coin flip comes up heads, and loses exactly $1 million if it comes up tails. Here is what a comparison of the expected values of each choice looks like:
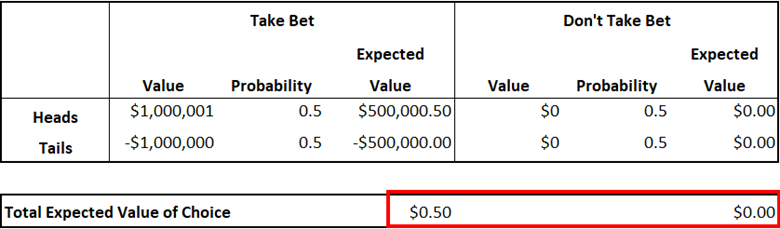
Strictly speaking, the optimal decision would be the one that maximizes expected payoff, so you should take the bet. However, not everyone would be comfortable with a 50% chance of having to pay $1 million. PrecisionTree’s Risk Profile report allows you to look at the possible consequences of each choice and their probabilities, before they get merged into a single “expected value.” This allows you to compare the worst case scenarios for each choice and their probabilities, and make a more informed decision based on your risk tolerance and personal preferences.
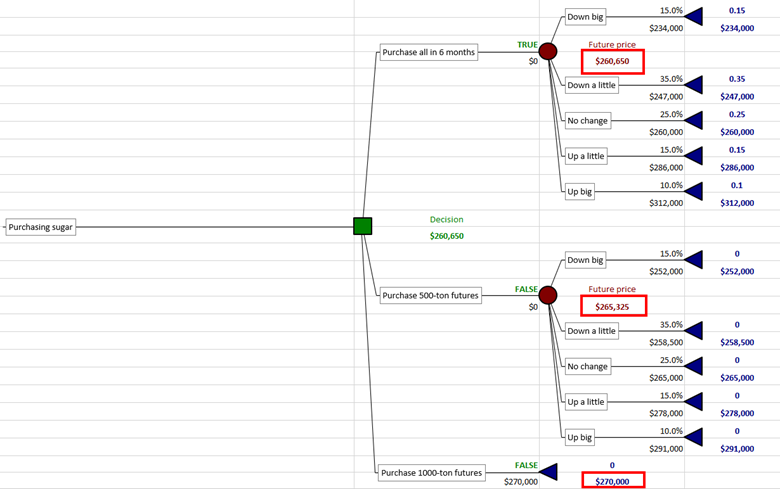
You can also modify a decision tree in PrecisionTree to force it to take a suboptimal decision. The forced decision then shows up as red in the tree model, and the overall value of the decision is recalculated accordingly:
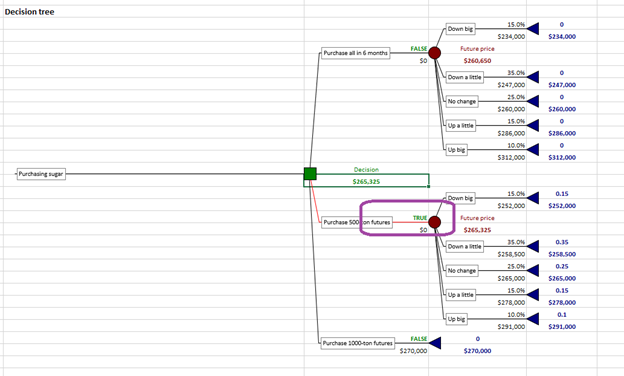
A forced decision in PrecisionTree.
Download a Copy of this Example Model >>
See how you can use PrecisionTree to analyze suboptimal decisions with a free 15-day trial of DecisionTools Suite.
