
Background
Founded in 1989, John Muir Land Trust (JMLT) of Martinez, CA was created to permanently preserve lands in Alameda and Contra Costa counties in California to safeguard fragile ecosystems. Protected spaces include areas such as Carr Ranch, 604 acres of coastal live oak, riparian woodlands, coastal scrub and annual grasslands, and Pacheco Marsh, 247 acres of former saltwater tidal marsh that JMLT is restoring. As a non-profit, the organization relies on donations, and conducts two mail fundraising campaigns per year. Prior to using @RISK, JMLT did a rough forecast of funds based on past campaigns.
Problem
Some nonprofits have appeal revenue streams that are reasonably predictable due to the fact that the organization’s funding request is more or less the same each time. “For example, I bet NPR can predict revenue by day of pledge drive with much accuracy,” says Jay Dean, Creative Strategy Director. “That’s not the case with us. We have different appeals due to the fact that we are raising funds for different properties --- and it is difficult to know in advance which properties will attract the most interest.”
Jay Dean
Creative Strategy Director, John Muir Land Trust
@RISK Forecasting Model Exceeds Expectations, Saves Money
“It is very helpful for us to know early on how the appeal cycle is doing,” explains Dean. “This can affect decisions whether or not to mail more letters, to mail reminders, to adjust expectations and/or our level of spending, etc.”
Dean uses @RISK to make these predictions. Using historical data (blue curve in Figure 1 below) he then used @RISK to create a model (green, below) of returns over time that best fit the data. According to this model, by day 40 the model expects 60% of total funds to have been received.
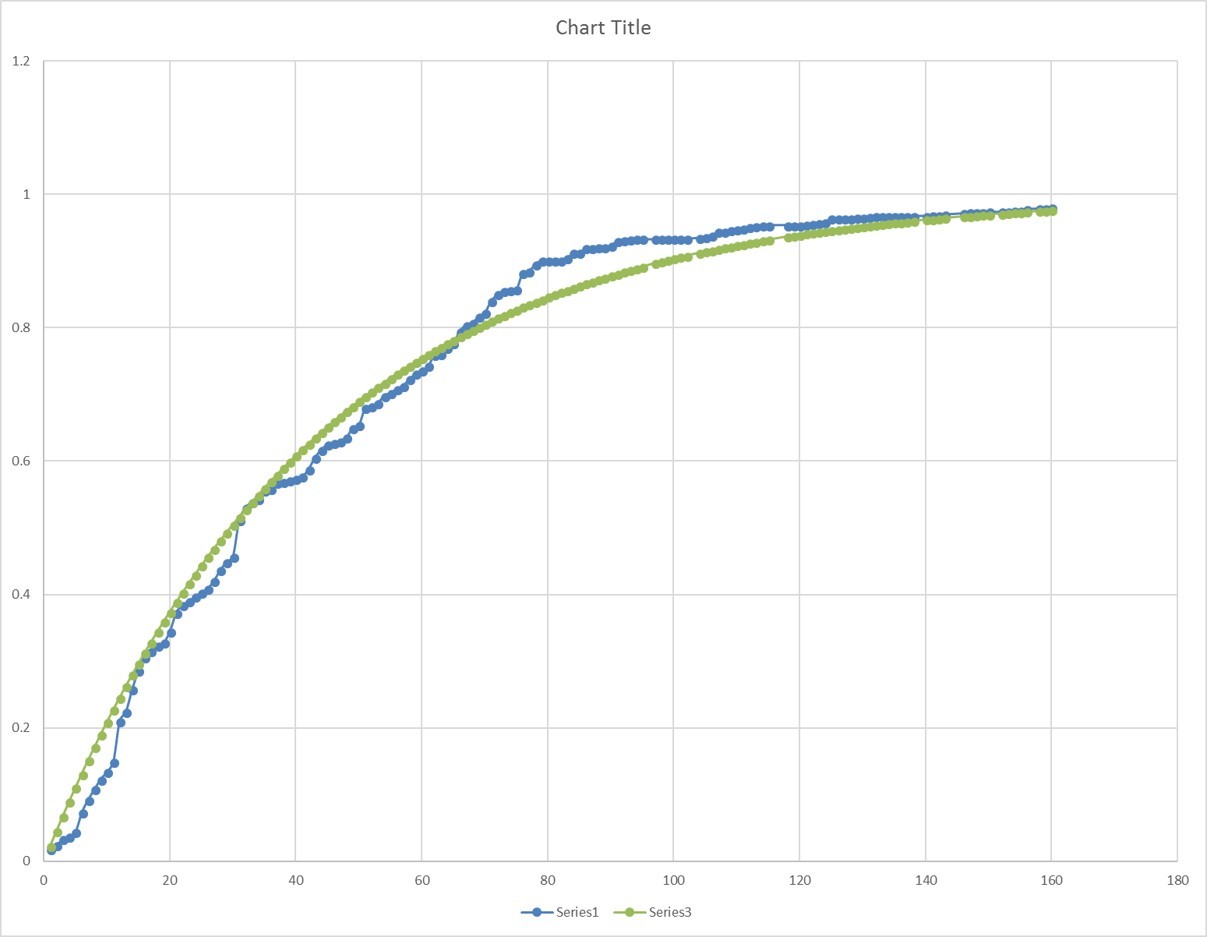 Figure 1: Percentage of total funds received (y axis with 1 = 100%) by number of days (x axis).
Dean then used this model during the next appeal cycle to forecast returns for the entire appeal. “Twenty days into the appeal, we got a good idea of final returns, and after 30 days things really settled into a pattern,” he says. Specifically, around day 32, the forecast settled down to roughly $150K.
 Figure 2: A scatter plot showing the predicted total funds (y axis) by day of forecast (x axis).
“This forecast far exceeded expectations, and allowed us to save money by not mailing out more paper than we had first planned,” Dean says, noting that his two favorite features of the software are its integration with Excel, and its ease of use.