
Founded in 2000, with approximately 100 professionals in offices across the U.S., and thousands of clients across the country and Puerto Rico, HealthCare Appraisers Inc. (HAI) is a leader in providing Fair Market Value analyses and consulting services for the healthcare and life sciences industries. Business valuation typically involves generating financial projections and discounting these projections to a single present value using a “discount rate” to estimate the economic value of a business or business interest. Within the healthcare industry, business valuation faces additional challenges due to the sophisticated and dynamic regulatory framework the industry operates within, creating a need for expertise and defensible business decisions. Given that individual providers such as doctors, physician assistants, and nurse practitioners deliver care on a personalized scale, the healthcare sector also features a significant human element, further complicating an already complex task of projecting future operations.
Multiple path-dependent scenarios modelled using @RISK
In the healthcare sector, business valuations are commonly performed in conjunction with transactions of ownership, when the value of a clinic or surgery center or other type of medical practice needs to be determined when a retiring physician, for example, plans to sell their practice to other physicians or healthcare businesses or groups. But they are used in numerous other situations as well: for tax, management or estate planning, divorce or litigation settlements, obtaining financing, and bankruptcy claims. They can also be critical in analyzing complex expansion scenarios, as was the case in 2015 when HAI was hired to perform a business valuation analysis on an ophthalmic surgery center in the southwestern U.S. that was considering a number of expansion options. HAI used the Monte Carlo simulation capabilities of @RISK to simulate scenarios and analyze the impacts of each scenario on the value of the business.
“@RISK helps our firm tackle the more quantitatively demanding projects by helping to model the inherent uncertainty surrounding complex business projections within the healthcare industry,” says Jarrod Barraza, an HAI Senior Associate based in Nashville, TN who helped perform the ophthalmic center analysis. “In the past when faced with multiple path-dependent scenarios such as these we may have relied upon static projections for each scenario and probability-weighted the results, yielding point estimates or a collared value range which don’t demonstrate the range and density of possible outcomes, or the main value drivers, in a meaningful way,” Barraza says.
The surgery center in the case explored here was a “single-specialty” surgery center that facilitated 3,500-4,000 surgical cases per year, earning $3.5-$4 Million in annual revenues. It historically performed mostly cataract surgeries but also offered a variety of other ophthalmic procedures, such as “YAG” laser, cornea, glaucoma and retina procedures. Approximately 20 surgeons, some with ownership interests, others with an interest in purchasing an ownership stake, brought volume to the center.
Jarrod Barraza
Senior Associate, HealthCare Appraisers
The client asked HAI to analyze outcomes for seven possible scenarios, with probabilities (in parentheses) supplied by management:
*Relocation (90% likely to occur) *Anesthesia Service Expansion (25% likely to occur) *YAGS Service Expansion (25% likely to occur) *Femptosecond Laser Expansion (50% likely to occur) *Interventional Pain Management Service Expansion (80% likely to occur) *Dr. 1 Leaving Center (75% likely to occur) *Dr. 2 Leaving Center (75% likely to occur)
For each scenario, HAI modeled revenue and expense projections to generate profit-loss statements expected to occur in the future, using both historical profit-loss statements provided by the client, and discussions with the center regarding their views of expected future operations. Inputs used included revenues, salaries, fees and wages, rent, maintenance and other costs, along with operational reports detailing historical volume metrics and the insurance makeup of the business (Medicare, Medicaid, Blue Cross / Blue Shield, Aetna, etc.). The team assigned Normal, Lognormal, Triangle or Pert Distributions for variables in each scenario according to economic assumptions, which were controlled by a “dummy variable” following a Bernoulli Distribution (two possible outcomes) to turn each scenario on and off, following the likelihood of each scenario to occur.
“I like to use a dummy variable that is assigned a Bernoulli distribution to control whether the entire scenario impacts the conclusion or not, within the simulation,” Barraza says.
HAI assigned outputs for each revenue and expense line item in order to track the impacts on each individual item of the different scenarios. Overall simulation outputs included, among others, Revenue, Salaries and Wages, and Occupancy Expenses. HAI also considered and applied a correlation matrix to the simulation variables, based on discussions with the center (i.e. “If Dr. 1 leaves, there is a higher probability Dr. 2 will leave”).
Among the outputs generated by @RISK in this and other simulations, Barraza says he uses Tornado graphs most frequently.
“This helps us check for reasonableness and ensure our assigned distributions are properly capturing the uncertainty we intend. We also view the histograms for each defined output to make sure it converges with our intuition and economic reality,” Barraza says.
“We like how easy it is to export graphics from @RISK into a report, and how the graphics themselves intuitively present our findings and help translate the complexity of the simulation modeling into layperson’s terms.”
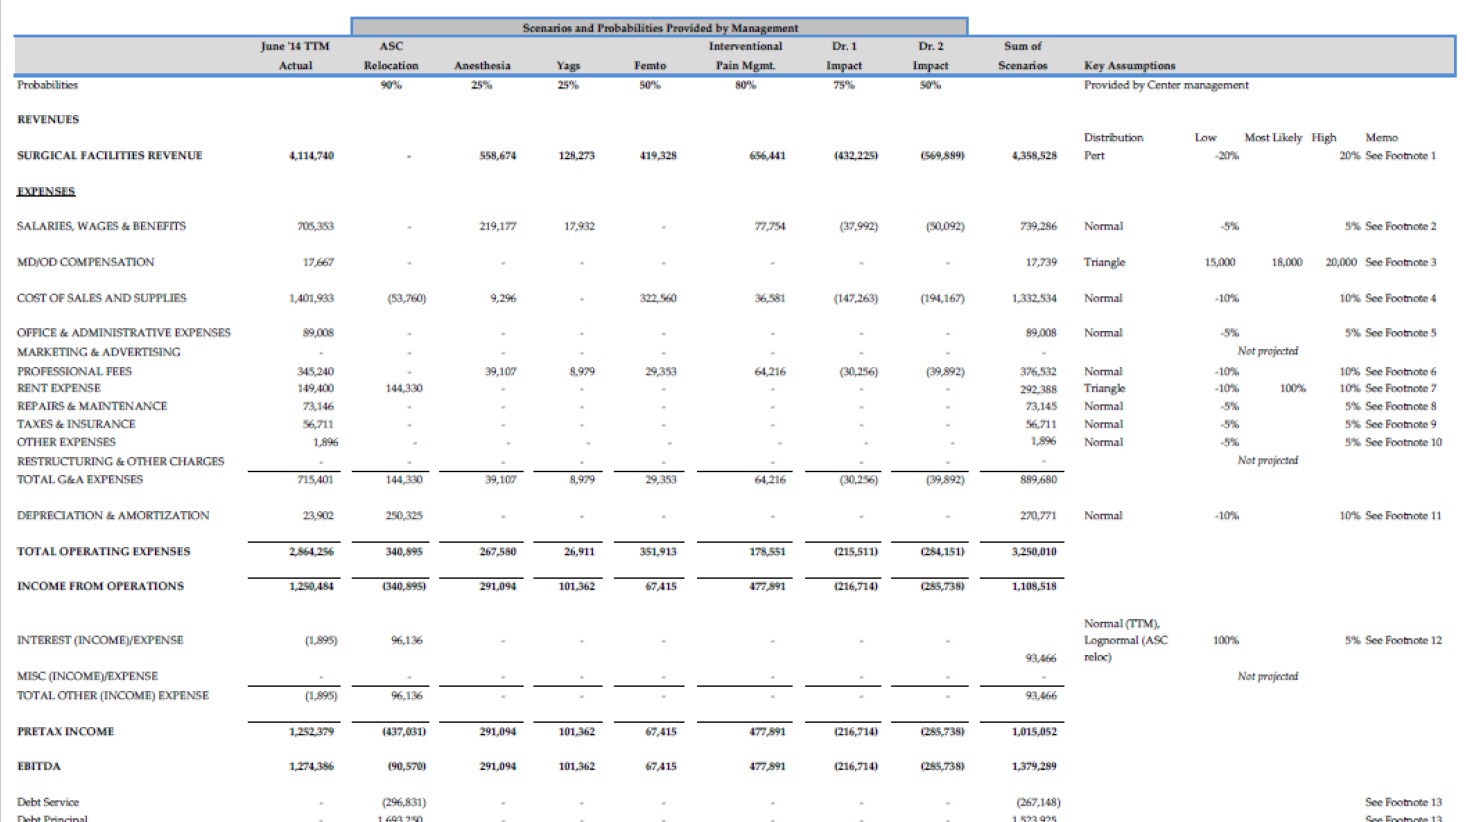 Models depend on information and input from management.
 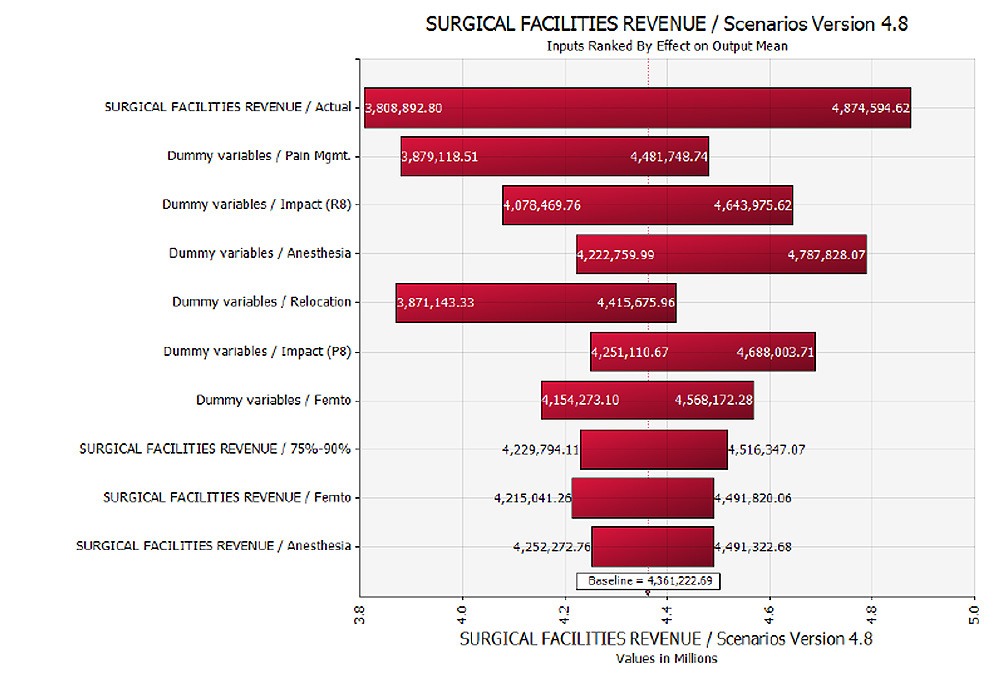 A Tornado Graph of factors influencing revenue, in one of many scenarios examined in a risk analysis.