FiduciaryVest Uses @RISK for Asset Allocation Modeling
The Critical Investment Challenges
Decision makers for all long-term investment pools face a critical challenge: Multi-year allocation among the various available asset categories. “This is the primary factor that determines long-term portfolio outcomes,” says Joe DiNunno, Asset Allocation Strategist, now a consultant to FiduciaryVest for Insightful Ideas. “Acceptable investment management within an underlying asset class is a secondary issue.”
“An additional challenge is communicating the solution to clients,” says DiNunno.
Over time, client portfolios have expanded from 5-6 asset classes to as many as 20 different asset classes. “Understanding the impact of diversifying a portfolio of a dozen or more assets requires an even more robust analysis,” says DiNunno.
To meet these challenges, DiNunno and his colleague, Gregg Buckalew, rely on detailed and extensive historical market data, investing expertise, and a highly sophisticated software that can deliver forecasted outcomes in a clear and comprehensible format—namely, @RISK.
Using @RISK
Traditionally, investment analysts use efficient frontier models to find an optimal portfolio mix with the lowest possible level of risk (standard deviation) for its level of return (mean).
“An efficient frontier model assumes that all asset class returns follow a normal distribution,” says DiNunno. “While this approach can provide useful results for short time periods, it still leaves many questions unanswered. This is where tools like @RISK come into play.”
@RISK allows DiNunno and his team to determine a different and specific probability distribution for each asset class.
“While asset classes are usually modeled with a normal distribution, I found that through @RISK’s distribution fitting feature both the income and total returns for bonds are better represented by the lognormal distribution.”
@RISK also allows DiNunno to realistically incorporate the effect of time horizons longer than one year. “This is important because volatile assets, like stocks, require longer modeling timelines, at least 3 to 5 years, to be realistic,” he says. “@RISK’s models also show clients how longer time horizons increase the benefits of diversifying the portfolio mix.”
Time Leads to Accuracy
Forecasting capital market outcomes is only reasonable when done for a future period that’s long enough to reduce short-term randomness.
Trust the Process
Sudden, external market trauma (one-off acts of terrorism, sudden systemic market failure, etc.) does not negatively affect multi-year mean/variance modeling.
Joe DiNunno
Asset Allocation Strategist
Just Because it Could, Doesn’t Mean You Should
It is not within the FiduciaryVest model’s capabilities or purpose to forecast the timing of very low-probability occurrences, even when such events fall within its distri- bution range. (i.e. 2008 market events, returns forecasted in the “tails”)
Incorporating Complexity for Better Forecasts
With @RISK enabling more sophisticated modeling, DiNunno and Buckalew have discovered ways to improve financial forecasts at FiduciaryVest even more.
“We’ve moved away from using just historical data to predict long-range behavior of assets and turned to what we call a ‘building blocks’ approach,” says DiNunno.
The foundation of the “Building blocks” is the current market-determined, risk-free interest rate for the client’s investment time horizon. Beginning with that risk-free rate, DiNunno adds successive layers of known historical risk premia for each investment category (reflected in its range/randomness of returns) to establish the mean of its return distribution. “This provides a logical expected return for each asset class based on its historical patterns,” says DiNunno.
Long-term historical data is also used to estimate the future performance of an asset’s standard deviation and cross correlation with the other categories’ returns.
Planning for “Black Swans”
With their careful analysis of historical events, DiNunno and Buckalew recognized that so-called “Black Swan” events such as the financial crisis of 2008 were far more common than the normal distribution models indicate.
“While the normal distribution assigns about a one-in-one-thousand chance for the stock market to crash as it did in 2008, these types of declines occur more frequently than that,” says DiNunno.
Instead, historical data shows that declines or increases of 3 standard deviations or more, over 6 months to a year, has occurred 2 out of every 100 rolling time periods.
To incorporate greater realism into their financial models, DiNunno used @RISK to combine standard distributions that feature more realistic ‘fat tails’, in which outlier events are more common (Figure 1.)
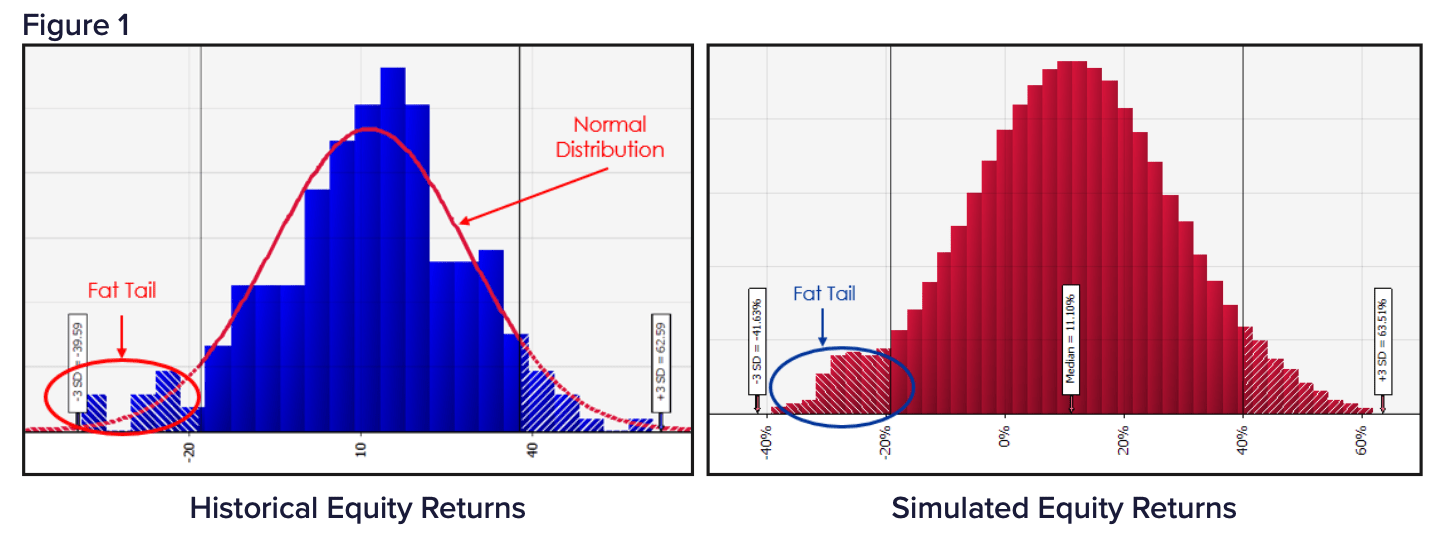 Normal distributions do not account for the greater frequency of “Black Swan” events—large increase or declines in returns. With @RISK, the analysts could create more sophisticated and realistic models with “fat tails” that showed the greater likelihood of these extreme events.
Capturing Correlations
DiNunno also noticed that the 2008 crash revealed that correlations between most asset classes were, at least temporarily, much higher than expected. He turned to @RISK to incorporate stress scenario correlations into the FiduciaryVest asset allocation model by adding a second correlation table.
“This is now used by the model during simulation runs when equity returns land in the lower left tail (extremely negative) of the return distribution,” says DiNunno. “In this case, the correlations between most asset classes are higher than in a normal financial market, but are lower for the few that often experience positive returns during significant drawdowns in equity investments.”
The @RISK Advantage
Incorporating longer time horizons and probability functions associated with asset classes, DiNunno and Bucklew used @RISK to address issues that cannot be addressed using static or optimized financial models, including the probability of:
- A negative return over specific time periods
- The client’s portfolio reaching its targeted return over a given time period
- Meeting a client’s financial obligations without tapping into portfolio principal
- A client reaching their retirement goals with a custom target date portfolio vs. a proprietary target date product
“Using @RISK to answer these questions helps us give clients real- world insight into what to expect from their portfolio,” says DiNunno. “More importantly, the models give our clients a strong indication of the impact that each component of asset allocation and diversification delivers in terms of their specific needs for future investment returns and risk management.”