Mitigate Risks


| Feature | Benefit | Professional Edition | Industrial Edition |
|---|---|---|---|
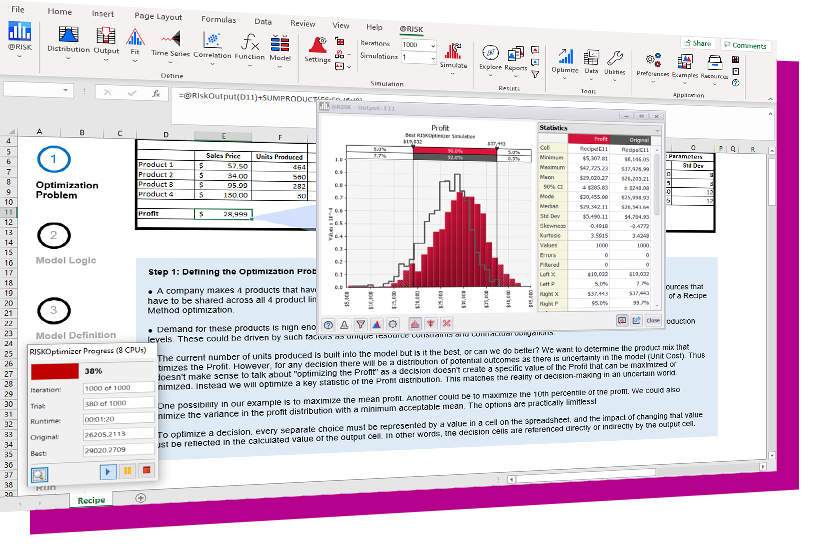
| Optimization under uncertainty | Combines Monte Carlo simulation with sophisticated optimization techniques to find optimal solutions to uncertain problems. Used for budgeting, allocation, scheduling, and more. |  |  |
| Efficient Frontier Analysis | Especially useful in financial analysis, Efficient Frontiers determine the optimal return that can be expected from a portfolio at a given level of risk | | |
| Ranges for adjustable cells and constraints | Streamlined model setup and editing | | |
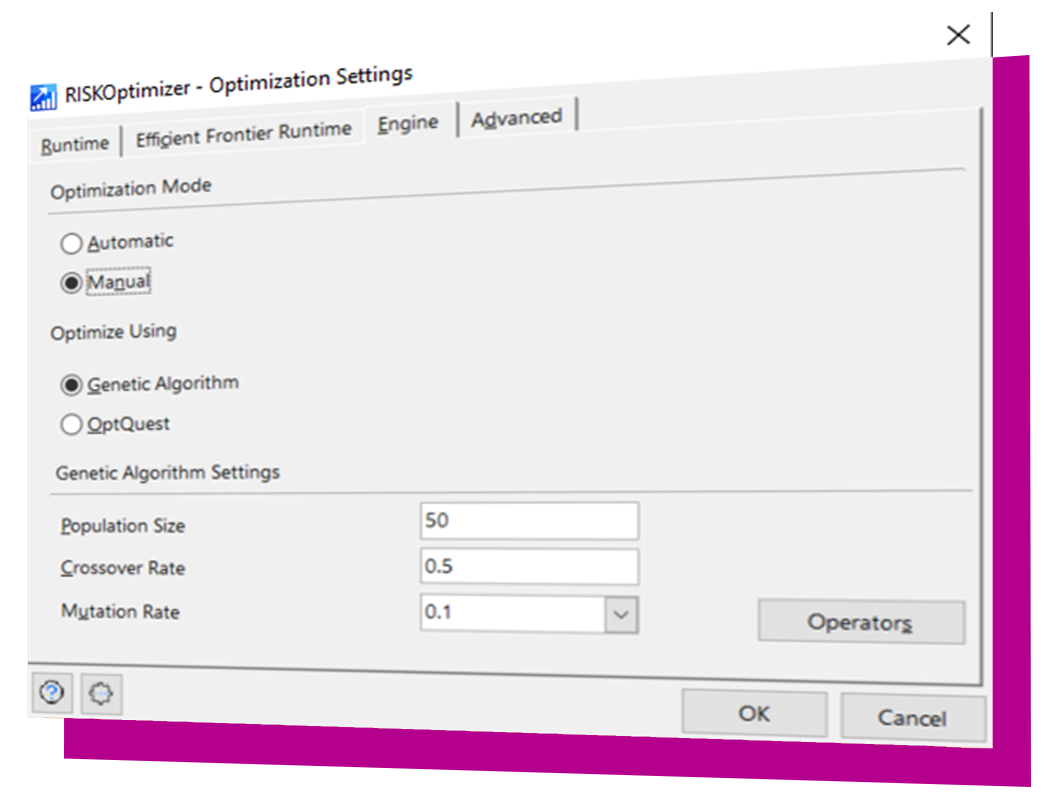
| Genetic algorithms | Find the best global solution while avoiding getting caught in local, “hill-climbing” solutions | | |
| Six solving methods, including GAs and OptQuest | Always have the best method for different types of problems | | |
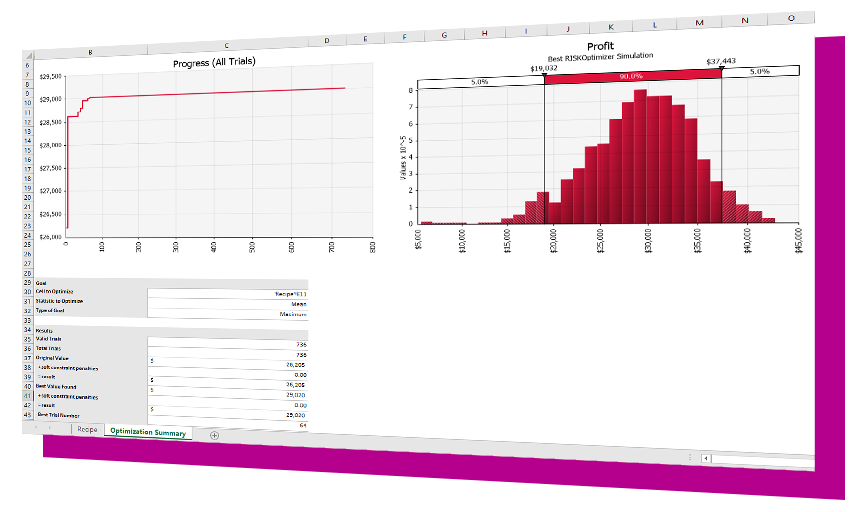
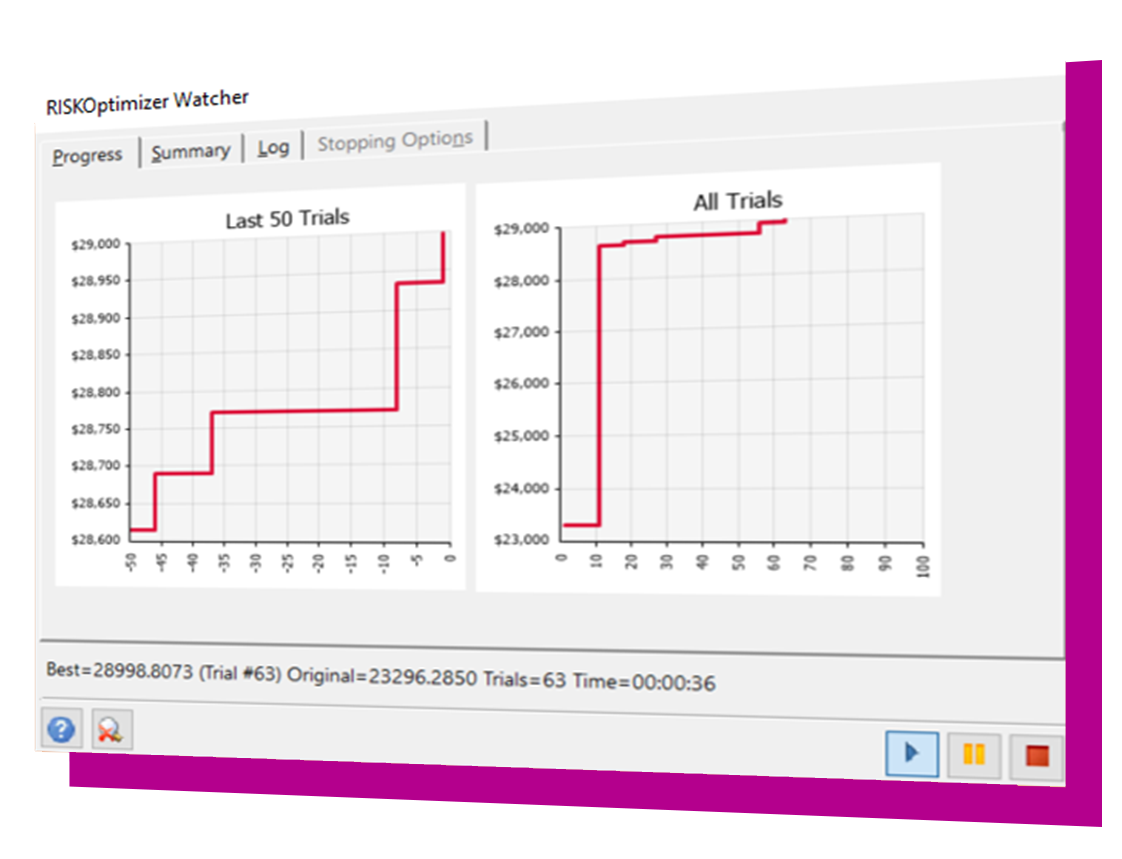
| RISKOptimizer Watcher and Convergence Monitoring | Monitor progress toward best solutions in real time | | |
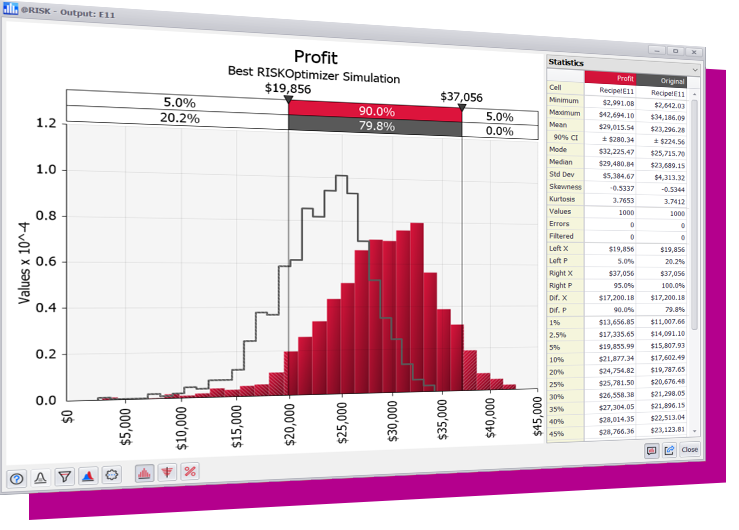
| Overlay of Optimized vs Original Distribution | Compare original output to optimized result to visually see improvements | | |
| Original, Best, Last model updating | Instantly see the effects of three solutions on your entire model | | |
The complete risk and decision analysis toolkit, including @RISK, PrecisionTree, TopRank, NeuralTools, StatTools, Evolver, RISKOptimizer, and ScheduleRiskAnalysis.